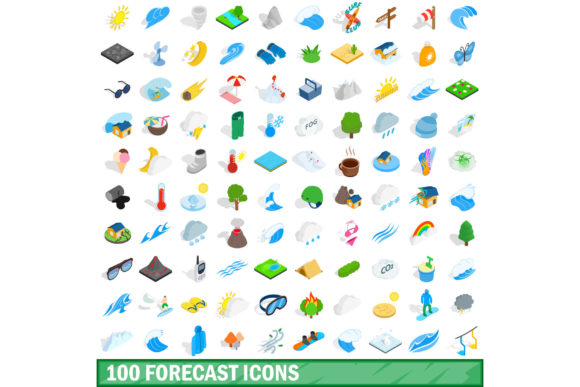
The Visual Grammar of Prediction: Understanding the 100 Forecast Icons Set
Forecasts are woven into nearly every decision we make, from choosing what to wear to planning multimillion-dollar business strategies. Yet the power of a forecast often depends less on the underlying data and more on how quickly and clearly that data is communicated. This is where iconography steps in as a universal shorthand. The 100 Forecast Icons Set represents a deliberate attempt to standardize and enrich the visual language of prediction, offering a library that spans from everyday weather symbols to abstract indicators of trend, probability, and change. Understanding what such a collection offers, how it can be applied, and where its limits lie is valuable for anyone who works with information, whether you are a dashboard designer, an educator, or a homeowner checking the weekend outlook.
From Weather Symbols to Decision Tools
The most familiar forecast icons are those for rain, sun, snow, and cloud cover. These symbols have been refined over decades, and a well-designed set makes them instantly recognizable even at a glance. However, a comprehensive set like the 100 Forecast Icons Set extends far beyond these basics. It includes variations for intensity, such as light rain versus heavy downpour, and combinations that capture mixed conditions, like partly cloudy with a chance of thunderstorms. This granularity matters. A logistics manager routing deliveries needs to distinguish between a light drizzle and a severe storm warning, and a single icon that communicates both the type and severity of weather allows for faster operational decisions.
Beyond atmospheric conditions, modern forecast icon sets often incorporate time-based indicators. A moon behind clouds for overnight forecasts, sunrise and sunset markers, and icons for UV index or air quality index all add layers of practical information. When these are part of a unified set, users can build a coherent visual narrative of an entire day or week without reading a single line of text. The cognitive load is reduced, and the information becomes accessible to a broader audience, including those who may not speak the local language fluently.
Translating Uncertainty into Visual Form
A forecast is inherently probabilistic, and one of the most challenging tasks in icon design is representing uncertainty. A simple sun icon suggests certainty, but real weather is rarely that absolute. Some of the most valuable icons in a 100 Forecast Icons Set are those that convey shades of doubt: a question mark over a cloud, a dashed outline for a low-confidence prediction, or a gradient fill that fades from one condition to another. These visual cues train users to interpret not just what might happen, but how likely it is to happen.
In fields like finance, epidemiology, and supply chain management, analogous icons serve similar purposes. A trend arrow with a dotted line indicates a projected trajectory with wide confidence intervals, while a solid arrow suggests stronger consensus. By borrowing visual conventions from weather forecasting, these domains gain a ready-made visual vocabulary. A researcher presenting model outputs can use the same icon for probable that a meteorologist uses for an 80 percent chance of rain, bridging disciplinary gaps in communication.
Professional Workflows and Data Dashboards
For professionals who build dashboards, reports, or internal tools, a coherent icon set is not a luxury but a necessity. The 100 Forecast Icons Set provides a consistent visual system that can be applied across multiple views and contexts. A financial analyst might use a different subset of icons than a meteorologist, but the underlying logic remains the same. Uptrends, downtrends, volatility signals, and status indicators can all be mapped to forecast-inspired icons, creating a seamless user experience.
Consider a business intelligence dashboard that tracks sales projections, inventory levels, and market sentiment. Instead of relying solely on numbers and text, designers can embed icons that convey the direction and confidence of each forecast. A green upward arrow with a solid fill might indicate strong growth, while a yellow sideways arrow with a dashed outline could signal flat growth with uncertainty. The user internalizes this information in milliseconds, freeing mental resources for deeper analysis. Consistency across the icon set ensures that once a user learns the visual language, they can apply it across every part of the interface.
Educational and Research Applications
Educators and researchers also benefit from a rich forecast icon library. In classrooms, icons help students grasp abstract concepts like probability, trend analysis, and conditional outcomes. A geography teacher explaining climate patterns can use the 100 Forecast Icons Set to illustrate not just current conditions but projected changes over time. The same icons can appear in textbooks, digital learning modules, and interactive whiteboards, reinforcing the same visual language across different media.
In research settings, especially in fields like climatology, epidemiology, and economics, icons serve as a compact way to annotate figures, maps, and timelines. A researcher publishing a paper on seasonal disease transmission might use a set of forecast icons to indicate outbreak probability across different regions and months. The icons communicate complex multivariate information in a format that is immediately accessible to readers, even those outside the specialty. This cross-disciplinary utility is one of the strongest arguments for investing in a comprehensive icon set rather than building a custom collection from scratch.
Creative and Hobbyist Use Cases
Beyond professional and academic settings, forecast icons have a place in creative projects, personal planning, and community tools. A hobbyist building a weather station at home can integrate the 100 Forecast Icons Set into a personal dashboard, displaying real-time conditions with professional-grade visuals. A community garden group might use forecast icons on a shared calendar to indicate planting windows, frost warnings, and irrigation needs.
Bloggers, content creators, and social media managers also find value in these icons. A travel blogger might embed forecast icons in an itinerary post to give readers a quick sense of expected conditions at each destination. A parenting blogger could use icons to communicate weekly activity recommendations based on weather and air quality. In these contexts, the icons function as both decoration and information, enhancing visual appeal while serving a practical purpose. The key is that the set is large enough to cover diverse scenarios without forcing the creator to mix icon styles from different sources, which can create visual dissonance.
Design Considerations and Visual Consistency
Not all forecast icon sets are created equal, and the design philosophy behind a collection like the 100 Forecast Icons Set matters immensely. Consistency in stroke weight, corner radius, color palette, and level of detail ensures that icons work together as a system. When icons are combined in a grid, list, or timeline, they should feel like they belong to the same family. This coherence is what separates a professional tool from a random assortment of clip art.
Another critical consideration is scalability. Icons that look good on a large desktop monitor may become illegible on a smartwatch or a small widget. A well-designed set includes simplified versions or maintains clarity at very small sizes through careful use of negative space and bold shapes. For developers and designers, having a set that includes multiple formats, such as SVG, PNG, and icon font equivalents, simplifies implementation across web, mobile, and desktop environments.
Accessibility is equally important. Color should never be the sole means of conveying information, because not all users perceive color in the same way. Shapes, patterns, and labels should reinforce the icon meaning. A rain icon that relies only on blue coloration may be indistinguishable from a snow icon to a user with color vision deficiency. The 100 Forecast Icons Set should incorporate shape differences, such as droplet forms versus crystalline forms, to ensure that meaning is preserved regardless of how color is perceived.
Implementation and Integration Strategies
Adopting a forecast icon set is not just a design decision but a technical one. Teams need to consider how icons will be loaded, cached, and rendered across different devices and network conditions. SVG icons offer resolution independence and small file sizes, making them ideal for responsive interfaces. For developers, using a sprite sheet or an icon library with tree-shaking capabilities ensures that only the icons actually used are loaded, keeping performance optimized.
In content management systems, forecast icons can be integrated as custom blocks or shortcodes, allowing non-technical editors to insert them into pages and posts without touching code. This democratizes the use of the icon set, enabling educators, marketers, and communicators to incorporate visual forecasts into their work independently. Documentation and style guides play a crucial role here. Even the most intuitive icon set benefits from clear naming conventions and usage examples, especially when it includes more than 100 distinct symbols.
Trends in Forecast Iconography
The evolution of forecast icons reflects broader trends in data visualization and user interface design. Flat design gave way to material design, and now we see a move toward what some call living icons, which animate or change state based on real-time data. A future iteration of the 100 Forecast Icons Set might include subtle motion, such as a pulsing glow for severe weather alerts or a rotating arrow for changing wind direction. These dynamic elements add another layer of information without requiring additional screen space.
Another emerging trend is personalization. Icons that adapt based on user preferences, location, or historical behavior can make forecasts feel more relevant. A set that includes icons for sunrise and sunset adjusted to the user's latitude, or icons for local phenomena like fog or dust storms, increases engagement and trust. The most effective icon sets are those that feel both universal and local, providing a shared visual language while accommodating regional variation.
Practical Observations for Everyday Users
For individuals who are not designers or developers, the 100 Forecast Icons Set still offers tangible benefits. Recognizing the difference between a slight chance and a high probability icon on a weather app can change how you plan a day. Understanding the symbols for UV exposure or pollen count can influence health decisions. As icons become more standardized across apps and devices, learning one set effectively teaches you how to interpret many others, building a form of visual literacy that pays dividends in daily life.
Even something as simple as a wind speed icon, with its curved lines suggesting gusts, communicates more quickly than a numerical value. The human brain processes images sixty thousand times faster than text, and forecast icons leverage this biological fact to compress complex information into instantly understandable symbols. The value of a comprehensive set is that it covers the full spectrum of conditions and probabilities, so you rarely encounter a situation where an icon is missing or ambiguous.
Balancing Completeness with Clarity
One challenge of a large icon set is the risk of overwhelming users. A set with 100 icons demands thoughtful organization and categorization. Icons should be grouped logically by theme, such as precipitation, temperature, wind, and probability. Within each group, a clear progression from mild to severe helps users quickly locate the icon they need. Search functionality, filtering, and preview tools further reduce friction.
Simplicity remains the ultimate benchmark. Each icon should communicate its meaning at a glance, without requiring a legend. If a user consistently misinterprets an icon, the icon is broken, not the user. The 100 Forecast Icons Set succeeds when it removes the need for explanatory text, not when it creates new ambiguities. User testing, even at a small scale, can reveal which icons are intuitive and which need refinement. The best sets are those that evolve based on real-world feedback, becoming more useful over time.
Ultimately, the 100 Forecast Icons Set is more than a collection of drawings. It is a communication tool, a design system, and a bridge between data and understanding. Whether you are building a dashboard, teaching a class, planning a trip, or simply checking the morning weather, the icons you see shape how you interpret the future. Investing attention in their design and application pays off in clearer decisions, fewer misunderstandings, and a more connected visual world.